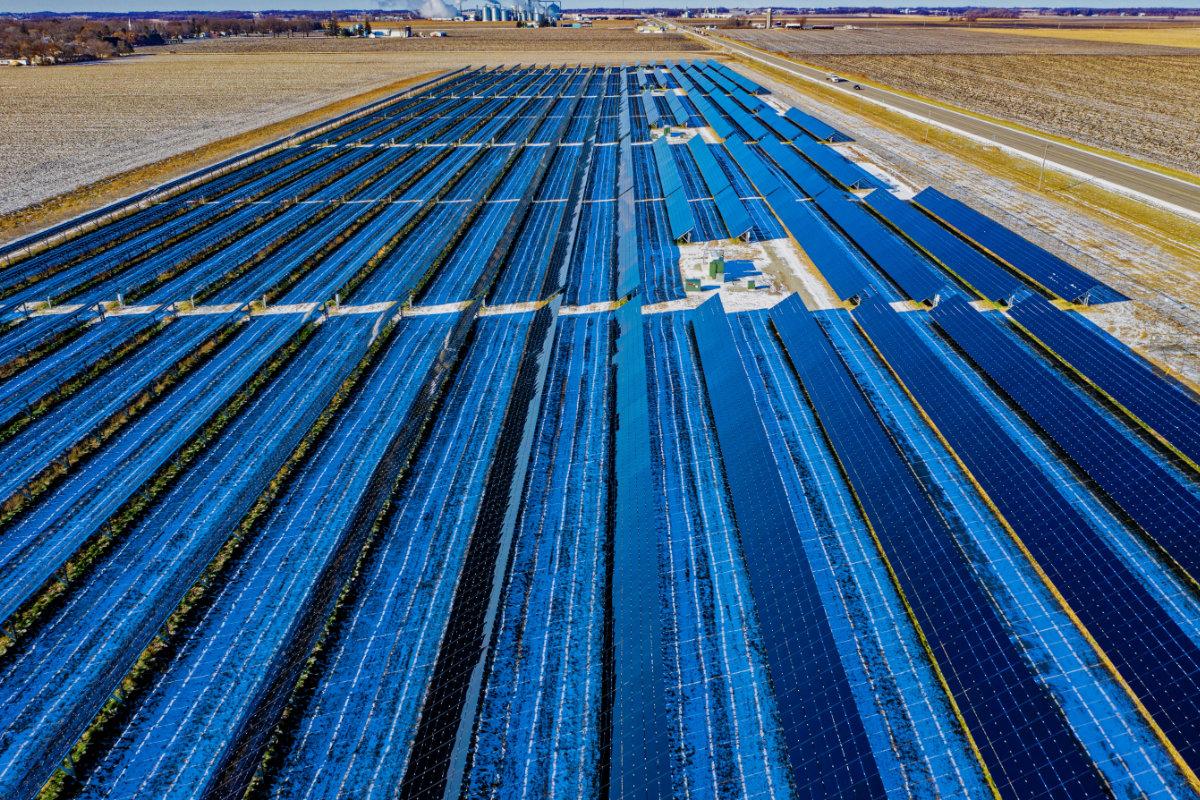
The US is seeing record amounts of solar energy production recently. In April, renewable energy – including solar, wind, and hydropower – actually outperformed coal for the first in U.S. history. However, solar is still a small percentage of the nation’s overall electricity. How do we compare with the rest of the world? And with the recent replacement of Obama’s sweeping Clean Power Plan and 180 on the Paris Agreement, what does the future hold for solar energy in the U.S. and world at-large?
U.S. second after China in solar capacity
As of mid-2019, the total installed capacity of solar installations across the world has reached about 500 gigawatts (GW), as reported in the IEA’s 2019 Snapshot of Global PV Markets.
Of that 500 GW, China dominates the landscape, with a cumulative capacity of 176 GW, driven largely by massive solar farms – some of the biggest in the world. The Tengger Desert Solar Park in northern China, for example, covers almost 17 square miles and can produce 1,547 MW of electricity – more than any other solar plant in the world.
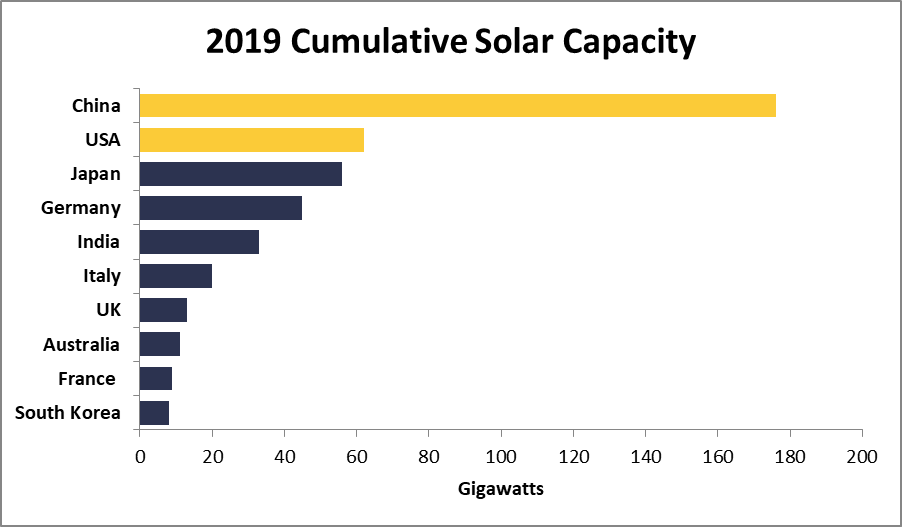
Image Source: Data from IEA Snapshot of Global PV Markets, Graph from Solar Tribune
After China, the United States falls second with 62 GW – about a third of China’s capacity. While the U.S. also boasts large utility-scale solar plants, smaller residential and commercial installations make up a large percentage as well. Japan falls in third place with 56 GW of solar capacity and Germany falls in fourth place at 45 GW.
It’s no surprise that the U.S. and China are the single biggest adopters of renewable energy, as they’re also the world’s biggest consumers of electricity as well.
Solar production per capita is a different story
While China and the U.S. lead in total capacity, thanks largely – though not exclusively – to their huge population sizes, it’s a slightly different story when looking at different data points.
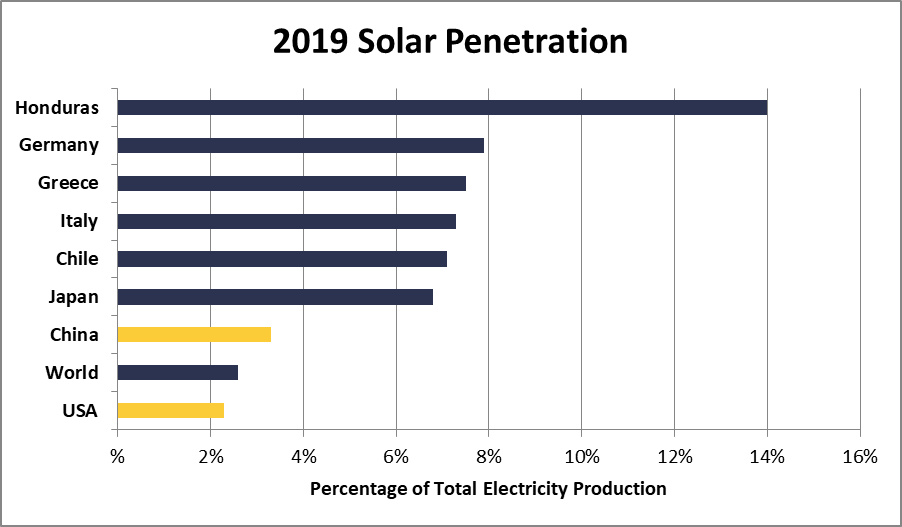
When comparing the amount of solar penetration (the % of total electricity that solar energy constitutes), the global leaders look quite different. Honduras enjoys the greatest percentage of solar-sourced electricity, producing 14% of its energy via solar panels. Germany, Greece, and Italy follow with 7.9%, 7.5%, and 7.3% respectively, followed by Chile and Japan.
Both China and the U.S. fall far down the line on this data point, with China covering 3.3% of its energy needs via solar and the U.S. covering 2.6% – actually below the global average.
When looking at each country’s solar production per person (kWh per capita), we see many of the same countries above. Germany and Japan lead in per-capita production, producing 463 kWh/person and 390 kWh/person respectively. The U.S. comes in 10th place with 173 kWh/person and China falls all the way down to 25th place, with 47 kWh/person.
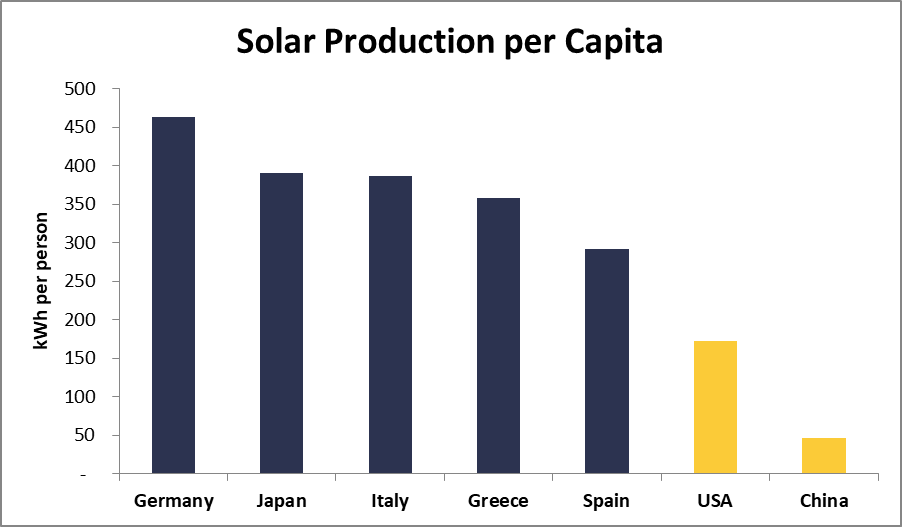
Image Source: Data from BP Statistical Review of World Energy, Graph from Solar Tribune
While China and the U.S. lead in total installed capacity, the actual penetration of solar energy is quite low in both countries. Japan, Germany, Italy, and a handful of other countries cover far more of their energy needs via solar.
What drives solar installations in the U.S. and abroad?
While the explosion in solar energy over the last 15 years has been driven by quickly falling prices, countries encourage solar for a variety of reasons, including emissions reduction, financial savings, safety, and energy security.
Regardless of location, the cost of solar panels has fallen like a penny off a skyscraper since the late-20th Century, and prices have continued their sharp decline in recent years. In 2014, the global spot price for multi-crystalline silicon solar panels (the most common PV solar technology) was $0.67 per watt, according to NREL’s 2018 Solar Cost Benchmark. By 2018, that had halved to just $0.30 per watt. Going back even further, the difference is even starker. In 2000, solar panels cost $3.10/watt. In 1980, they cost $24/watt!
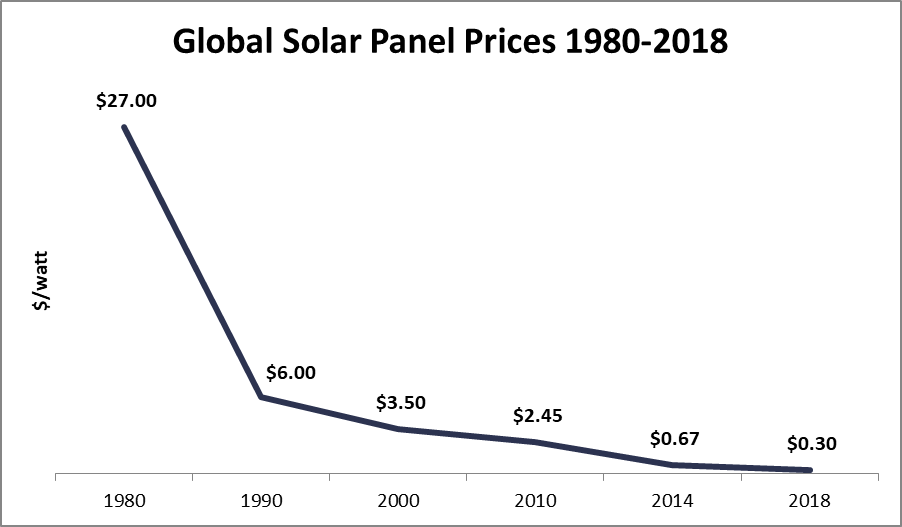
Image Source: Data from Renewable Energy World and NREL, Chart from Solar Tribune
While 6 kilowatts of solar panels (enough for a typical U.S. home) would’ve cost $144,000 forty years ago, today they cost about $1,800. At this price, both homeowners in developed countries as well as utilities and businesses can easily jump that investment hurdle.
Beyond the falling cost of solar technology, government policy to encourage PV adoption has played a major hand in the growth of solar, though the underlying reasons vary country to country.
In the U.S., 29 states and four territories have passed clean or renewable energy goals. Eight states and territories have even pledged 100% clean energy goals, including Washington DC, California, and New Mexico. Generally, emissions reductions are the main impetus for these clean energy goals, though energy security and cost reduction also play a part. Upon signing the 100% mandate into law in early 2019, New Mexico Governor Michelle Grisham said:
“The Energy Transition Act fundamentally changes the dynamic in New Mexico. This legislation is a promise to future generations of New Mexicans, who will benefit from both a cleaner environment and a more robust energy economy with exciting career and job opportunities.”
In other parts of the world, countries are moving towards renewables for emissions reductions, but also the safety and financial savings it can help bring about.
Germany and Japan were two of the first countries to adopt solar energy on a wide scale, when they both became the first countries to install 1 GW of solar capacity in 2004. Seeing the destruction that nuclear energy can wreak after the Fukushima earthquake in 2011, both Japan and Germany pushed forwards on renewables as a way to diversify and increase the safety and resiliency of their respective energy portfolios.
Japan adopted a Feed-in Tariff for renewable energy connected to the grid, and subsequently has seen major leaps forward, from 10% renewable in 2012 to 15% in 2016. In 2018, the country pledged to source 24% of all its electricity from renewable sources by 2030. It’s a modest goal, but a goal nevertheless.
After the Fukushima meltdown, Germany decided to phase out all nuclear plants earlier than planned and adopt more stringent renewable energy goals, mandating that 80% or more of electricity needs must be met with renewable energy by 2050, with intermediary goals of 35% by 2020 and 50% by 2030.
Suffering high electricity costs and energy rationing, Honduras began an energy reform in 2012. That year, fossil fuels accounted for 70% of its generation mix. The government hoped to spur utilities and private companies to move towards greater renewables and by 2018, renewables made up 75% of all electricity, a stunningly fast swing towards clean energy.
Renewables set to grow long-term, even in the U.S.
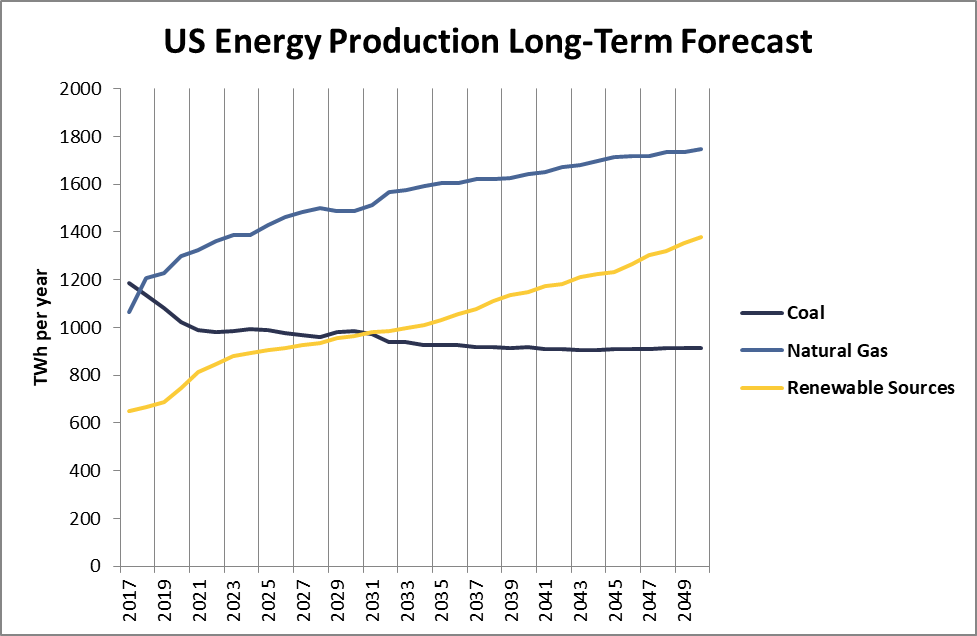
Image Source: Info from the EIA, graph from Solar Tribune
Solar energy production has increased drastically worldwide in the last two decades. In 2000, worldwide annual solar energy production was a dismal 1.15 TWh (terawatt-hours). By 2016, annual worldwide solar production had jumped to 333 TWh. In 2018, it jumped to over 400 TWh.
However, it’s important to keep these numbers in context to the larger energy industry. In 2018, the world consumed 23,000 TWh of electricity. At 400 TWh, solar energy made up just 1.7% of worldwide electricity production.
Solar energy though is set to continue expanding. The EIA expects solar production to continue biting ever-larger chunks out of the energy pie. It predicts solar will continue to steadily grow into the 2050s, driven by government incentives in the short-term and falling prices in the long-term. By 2031, solar production is expected to overtake coal permanently.
With the near-universal acceptance of the Paris Agreement, experts expect renewables – including solar – to make up an increasing portion of the energy landscape, as countries seek to curb carbon emissions and turn back the dial on global warming. Even in the U.S., where clean energy policy is notoriously difficult, solar energy and renewables will make up an ever-larger portion of electricity. The increase will not be driven by government mandate, but simple economics, as utilities continue to adopt renewables to replace expensive coal plants.
Image Source: Public Domain via Pexels