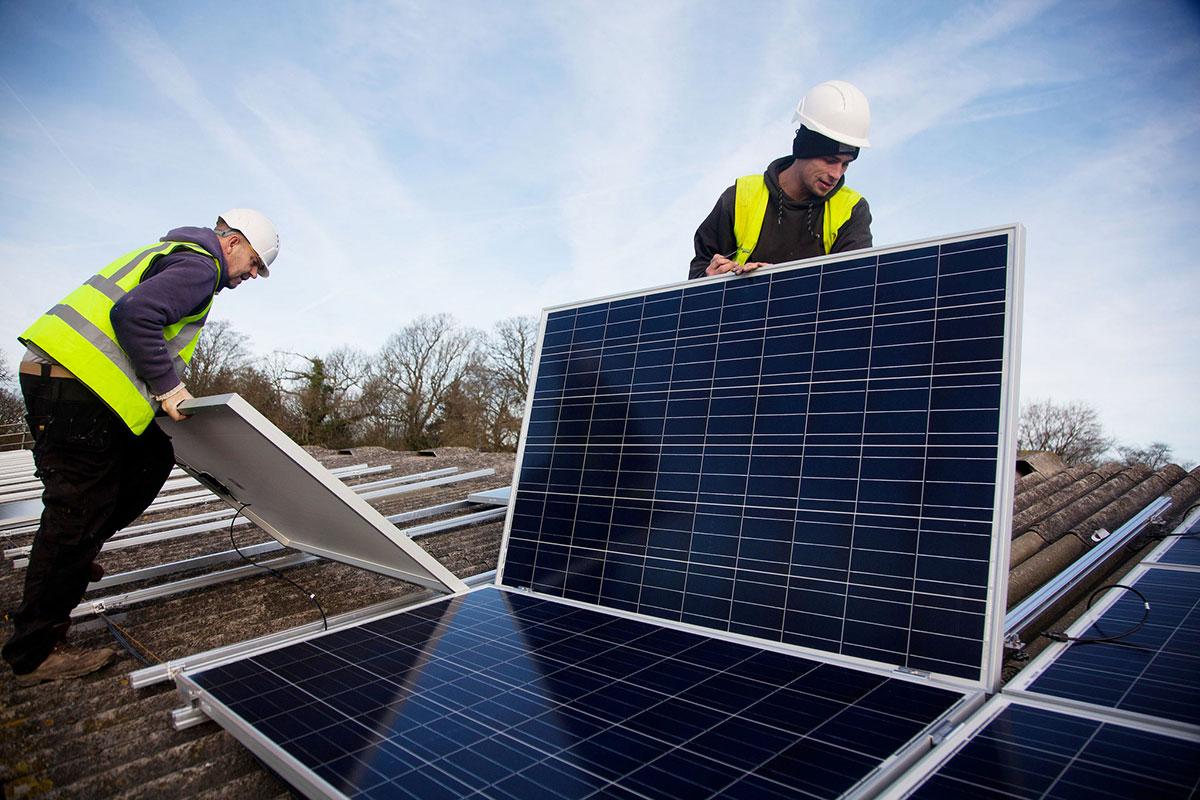
Since 2008, the U.S. has seen a veritable explosion of not just residential solar, but commercial and utility-scale installations as well, enjoying a ridiculously high annual growth rate of 54% over the last 10 years.
As of September 2018, there is now 58.3 GW of solar installed in the U.S., with the vast majority –23GW – installed in California alone. Government initiatives like the federal Investment Tax Credit (ITC) as well as state-led Renewable Portfolio Standards (RPS), and the ensuing utility incentives, opened the doors for this huge influx, spurred on by ever-decreasing technology and installation costs.
Thanks to this jaw-dropping increase in installations, solar and other renewables have accounted for 28% of all California electricity in 2018, as of this writing. And in fact, from March to August of this year, at max production, solar alone briefly made up over 40% of total production – a feat few would’ve believed possible just 10 years ago.
What Is the Duck Curve?
The Duck Curve is a cutesy name for a logistical problem suffered by utilities, brought on by the ever-growing number of solar installations. Take a look at the graph below, and you’ll notice a similarity to an eponymous waterfowl. Each line represents the average net load (the sum of all electricity currently consumed) in California over a 24-hour period.
Why do the lines continually become lower and lower, year after year? That’s new solar installations coming online. And as solar generation increases every year, utilities’ electrical load actually decreases, since homeowners and businesses are relying on their own solar installation – not the utility. You’ll see that load is lowest around 1 to 2 PM, when the sun is highest in the sky and solar installations are pumping out max electricity.

Courtesy CAISO 2013
As the sun begins to set, solar production begins to wane. At the same time, everyone is arriving home from work, doing laundry, turning on lights and water heaters, and watching TV. Electricity usage skyrockets, with peak usage right around 6 PM. These two events – solar production ceasing for the day and everyone getting home – causes the steep ramp captured in the image above.
In the course of those three hours, utilities must quickly ramp up production to meet that ‘peak demand’. And therein lies the issue.
Utilities Can’t Ramp Up Production Quickly Enough
Thanks to the continuing popularity of residential and commercial solar, the Duck Curve has grown at a rate far faster than originally estimated, with California ISO (CAISO) reporting that electrical load fell to just 11,663 MW on May 15, 2016, a number they weren’t expecting to see until four years later in 2020. A few months before that, they reported a 3-hour ramp of 10,892 MW.
To help put that number in perspective, consider that the average-sized residential installation is 5.7kW according to NREL, so 10,892 MW is equivalent to 1.9 million average residential solar installations.
This situation creates major headaches for utilities, as they have to ramp up huge quantities of electricity production in a very short period of time. That might sound like simply a mild annoyance, but it’s anything but, thanks to the scale of the issue and the importance of electricity in our day-to-day lives. In fact, many in the industry have noted the Duck Curve as solar’s greatest challenge.
Utilities’ conventional generation mix simply can’t handle these new challenges. Power plants, beyond peaker plants designed to meet short bursts of high demand and which are very expensive to run, simply weren’t designed to cycle on and off throughout the day. Doing so increases maintenance and wears out equipment faster, eating into the bottom line.
Storage and Flexibility Possible Solutions to the Duck Curve
Utilities and industry organizations like CAISO and the Regulatory Assistance Project have proffered various solutions to the issue over the years and utilities across the western states have implemented many of them.
The easiest solution? How about simply turning solar off? For a 2014 report, NREL found that utilities across the U.S. routinely curtail small amounts of wind and solar to prevent oversupply and/or transmission issues, with HECO in solar-heavy Hawaii specifically curtailing solar production to prevent oversupply during low load periods, i.e. during the belly of the duck.
While curtailment certainly solves the problem, it’s less than ideal, as it removes clean energy from the generation mix and disrupts the financial viability of the installation.
Utilicast, an energy consultancy, warns in their white paper A Market Solution to the Duck Curve that
“It should be noted that the problem is not how to flatten the curve, but rather how to deal with it. The “duck curve” will never go away. In fact the belly of the curve will grow larger as renewables become a greater and greater part of the resource mix.”
A better solution is one that works with, instead of against, the renewable assets. With energy storage continually dropping in price, batteries are becoming a viable solution to the issue. In summer 2018, Arizona Public Service issued an RFP for construction of 106 MW of battery storage to add to its solar power plant, with the plan of adding 500 MW of energy storage in the next 15 years. The batteries will store solar electricity to be used later during peak time.
Likely one of the most promising solutions to the Duck Curve is incorporating what are known as ‘flexible power plants’ into utilities’ generation mix. Unlike conventional power plants, these plants are able to repeatedly cycle on and off throughout the day, and ramp up more quickly than conventional plants.
While welcomed in solar-heavy Germany, the U.S. is a different playing field. Many US-based power plants are owned by private third-parties instead of utilities, so questions still remain on the long-term economic feasibility of this tactic, as owners would see no real economic benefit from decreasing production, unless new government-backed legislation or incentives are adopted.
Why Is It Important?
You might be wondering why all this even matters to an Average Joe. Maybe you’re thinking that it’s the utilities’ problem, not yours. However, if you value moving towards a world filled with clean energy, it’s not just utilities’ problem. It’s a challenge for all of us.
In the 10 years since NREL first noted the issue, the Duck Curve, in their own words, has
“become an emblem of the challenges faced by power system operators when integrating variable renewables on the grid.”
The fact that the Duck Curve is even a problem is a good sign. It means we’re doing something right. These are simply growing pains to a greener economy – but hopefully we’ll figure it out soon.
